Role
Animator • Motion Graphics
Summary
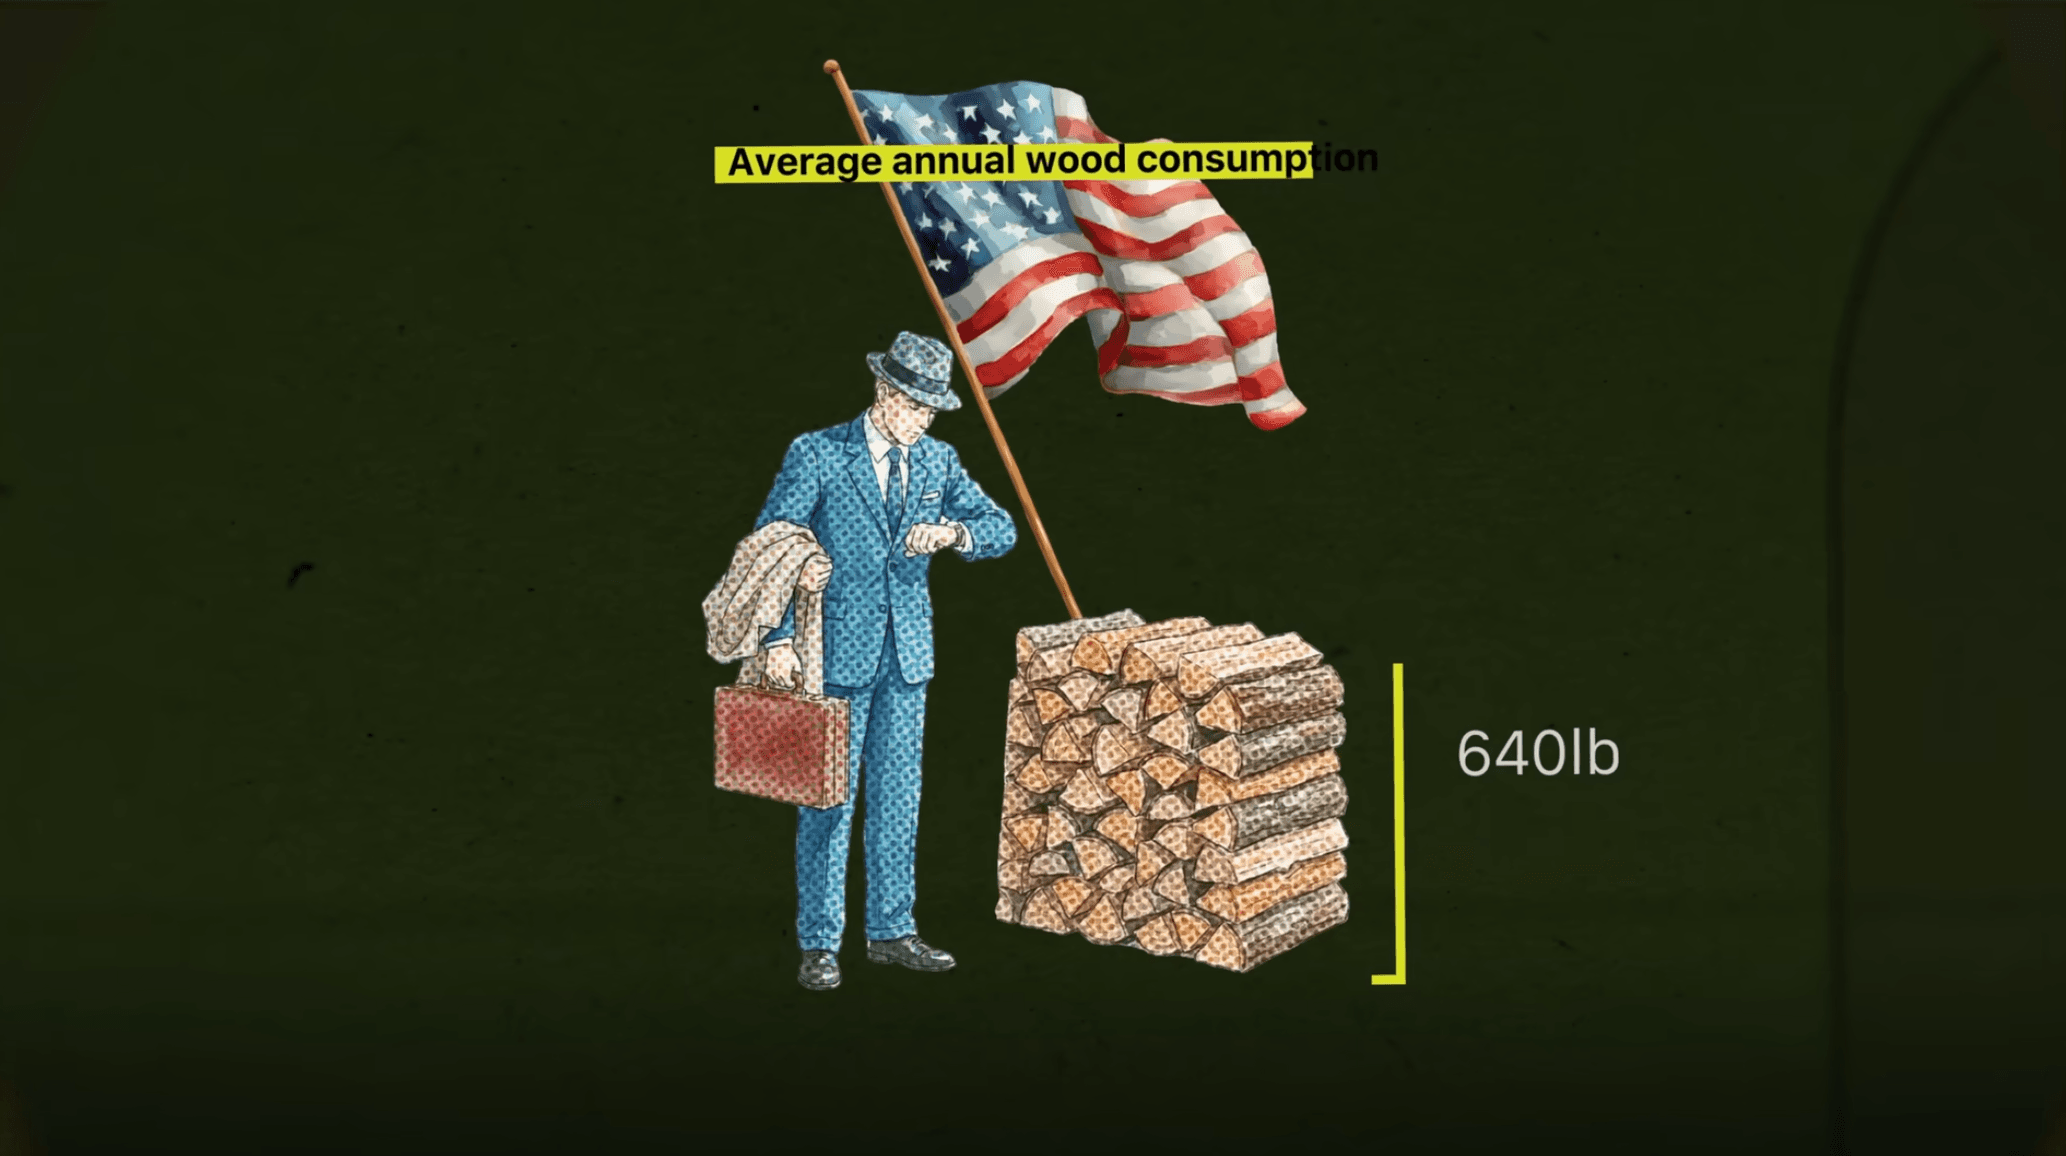
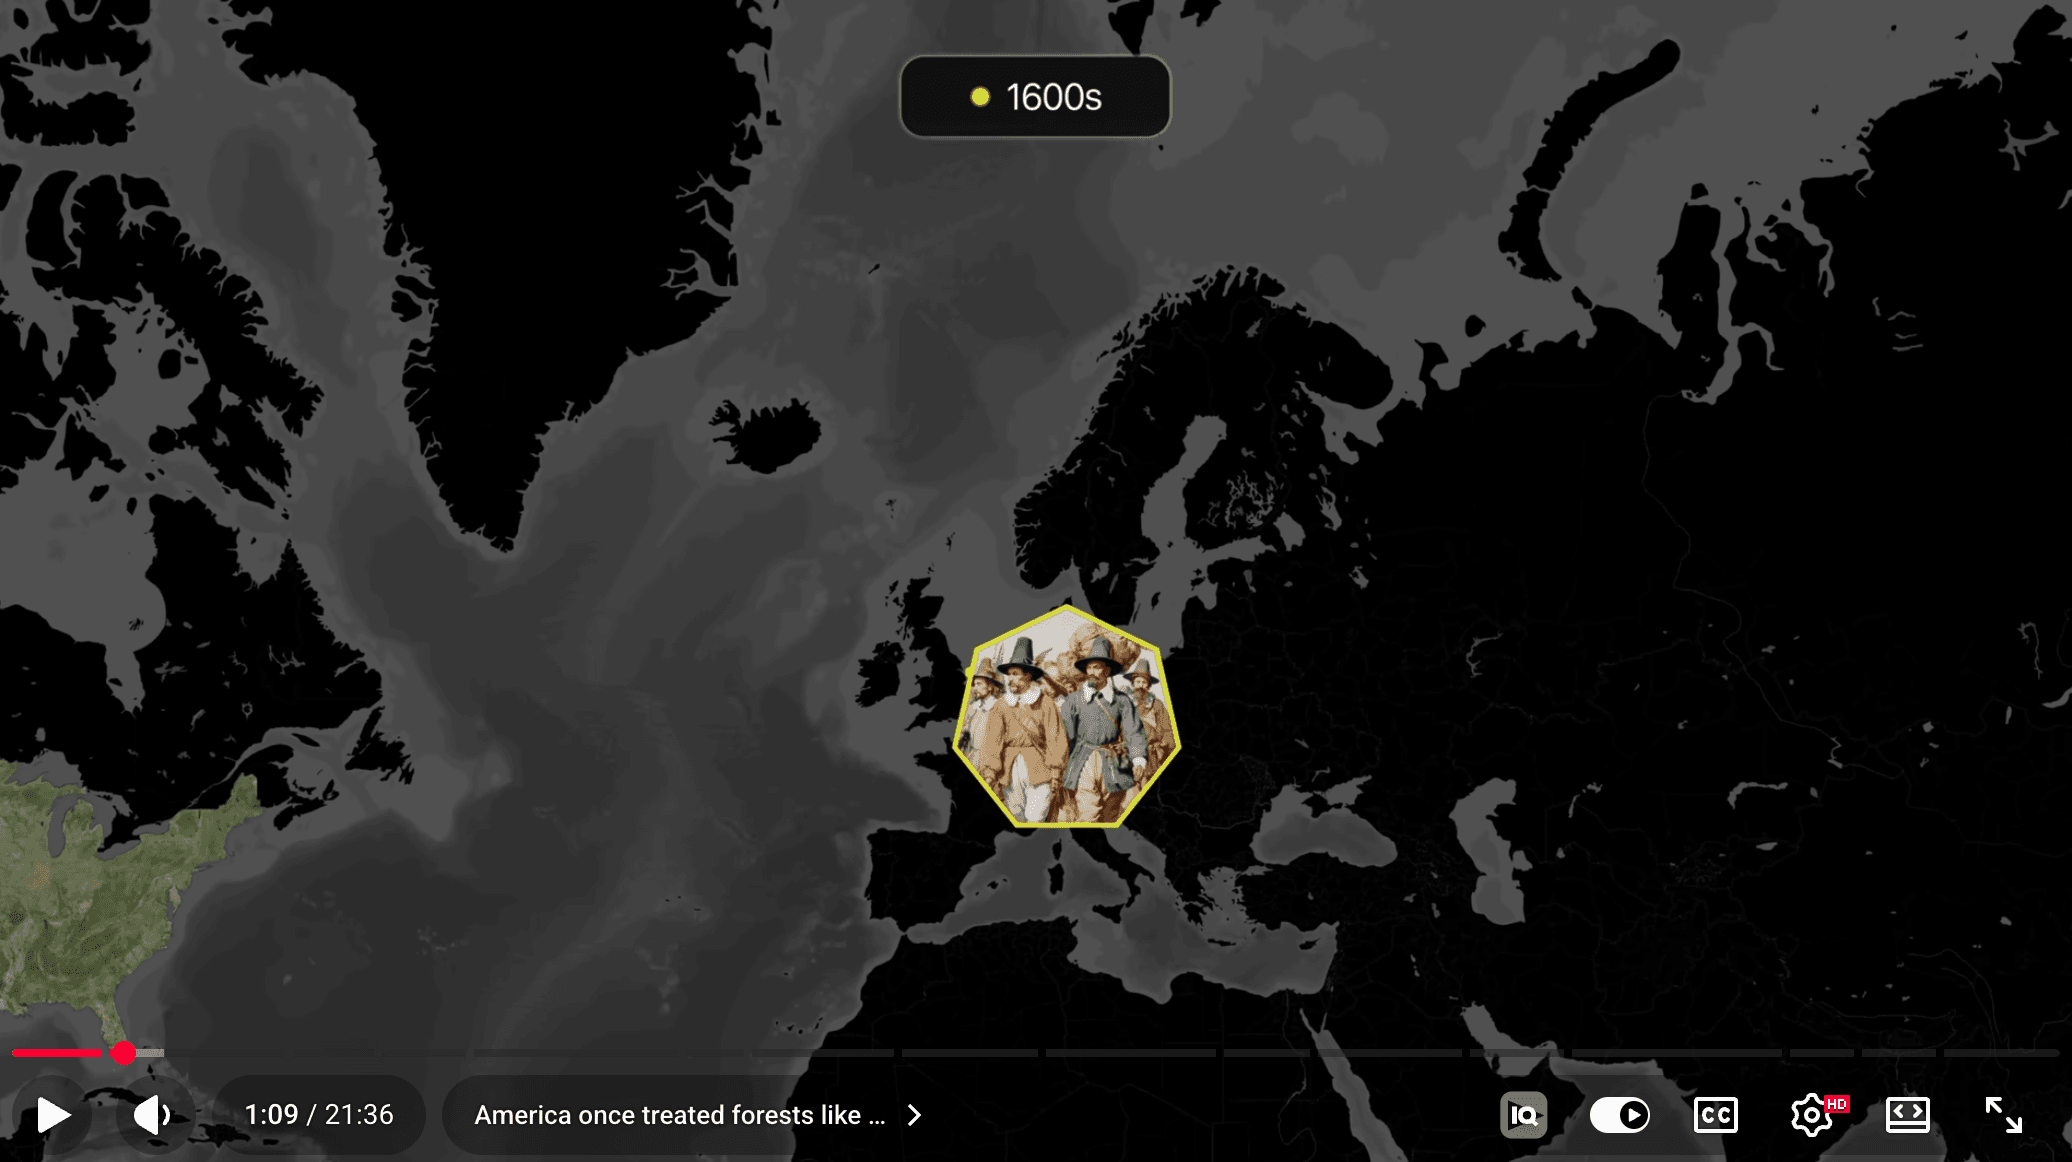
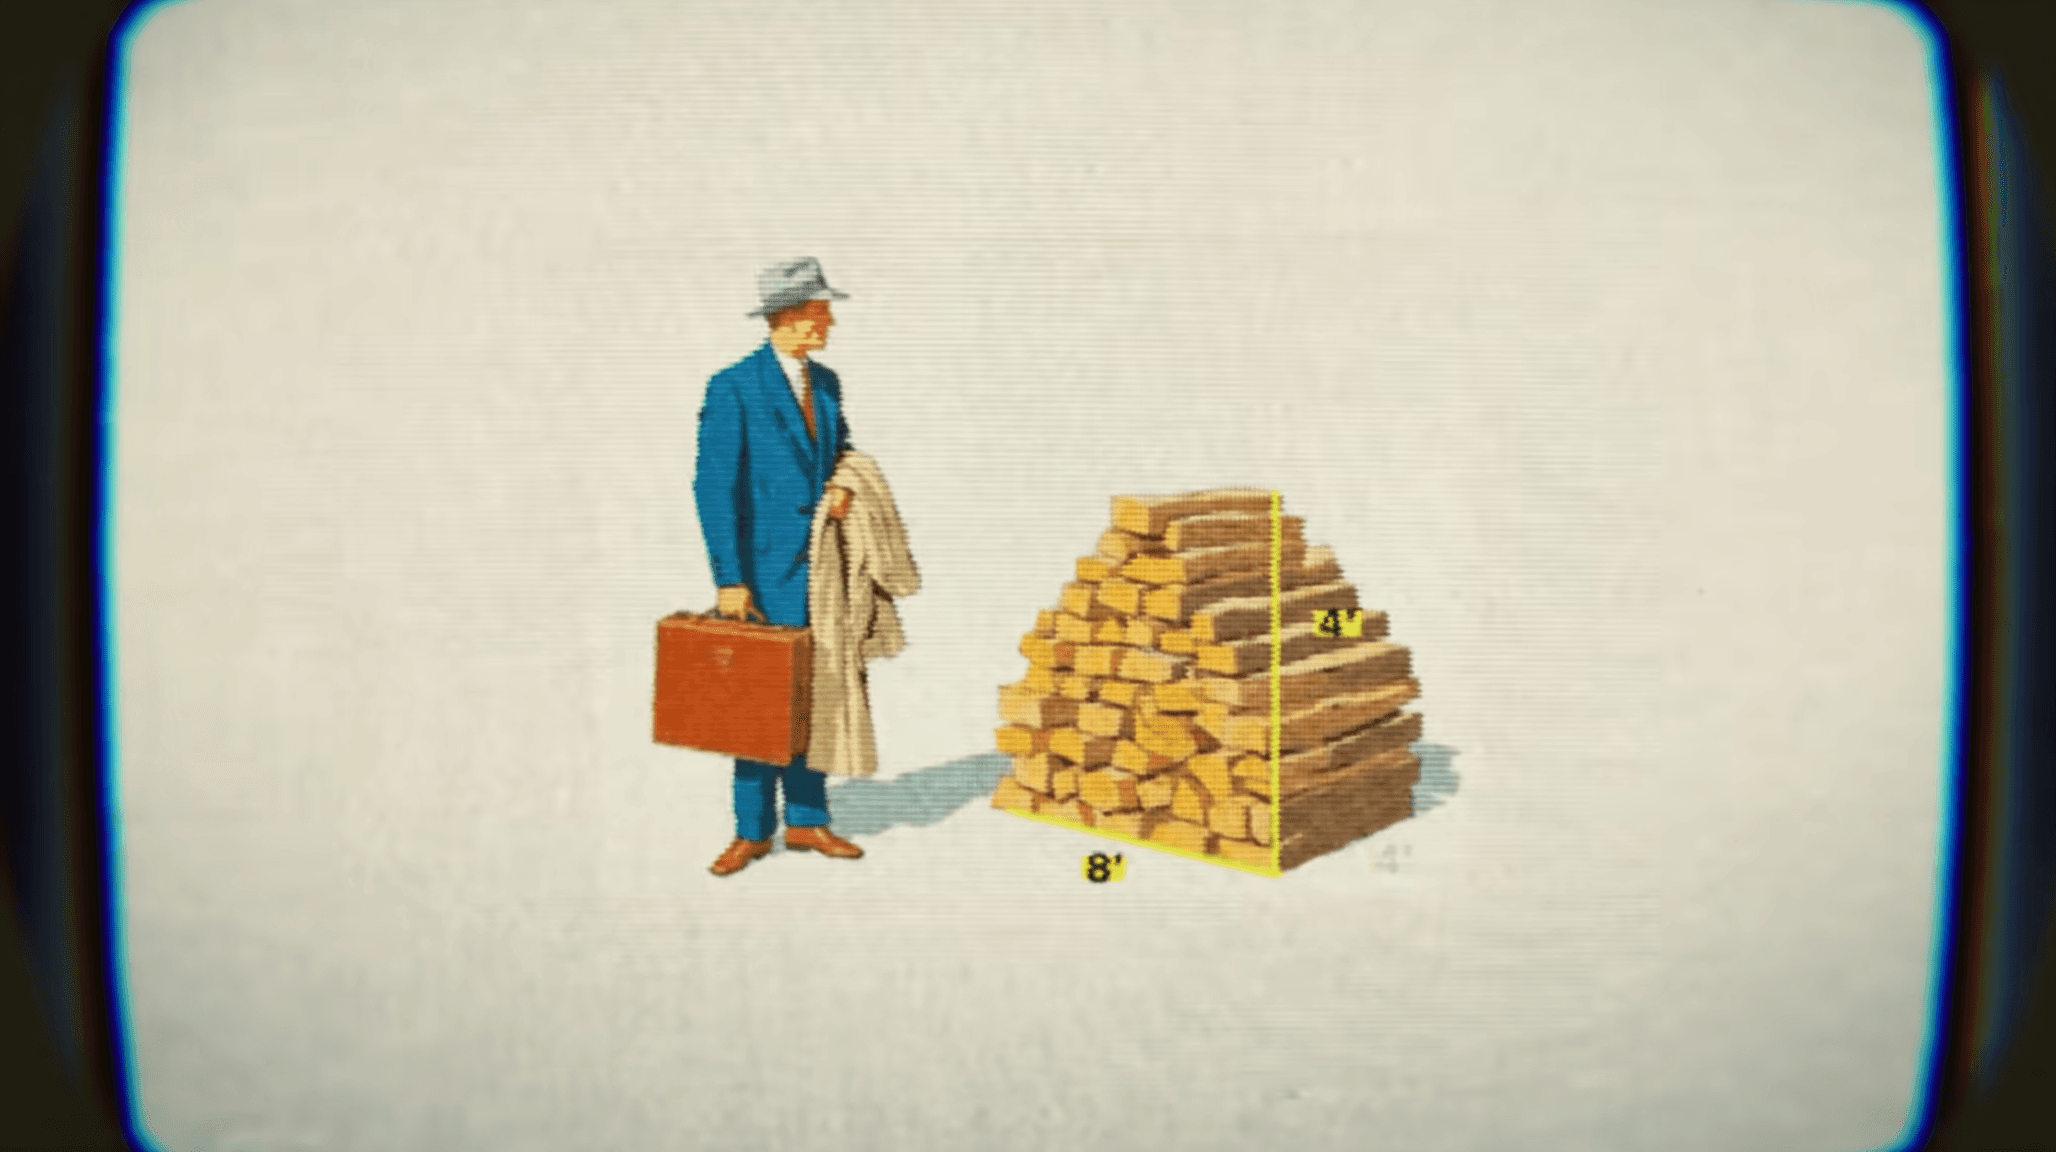
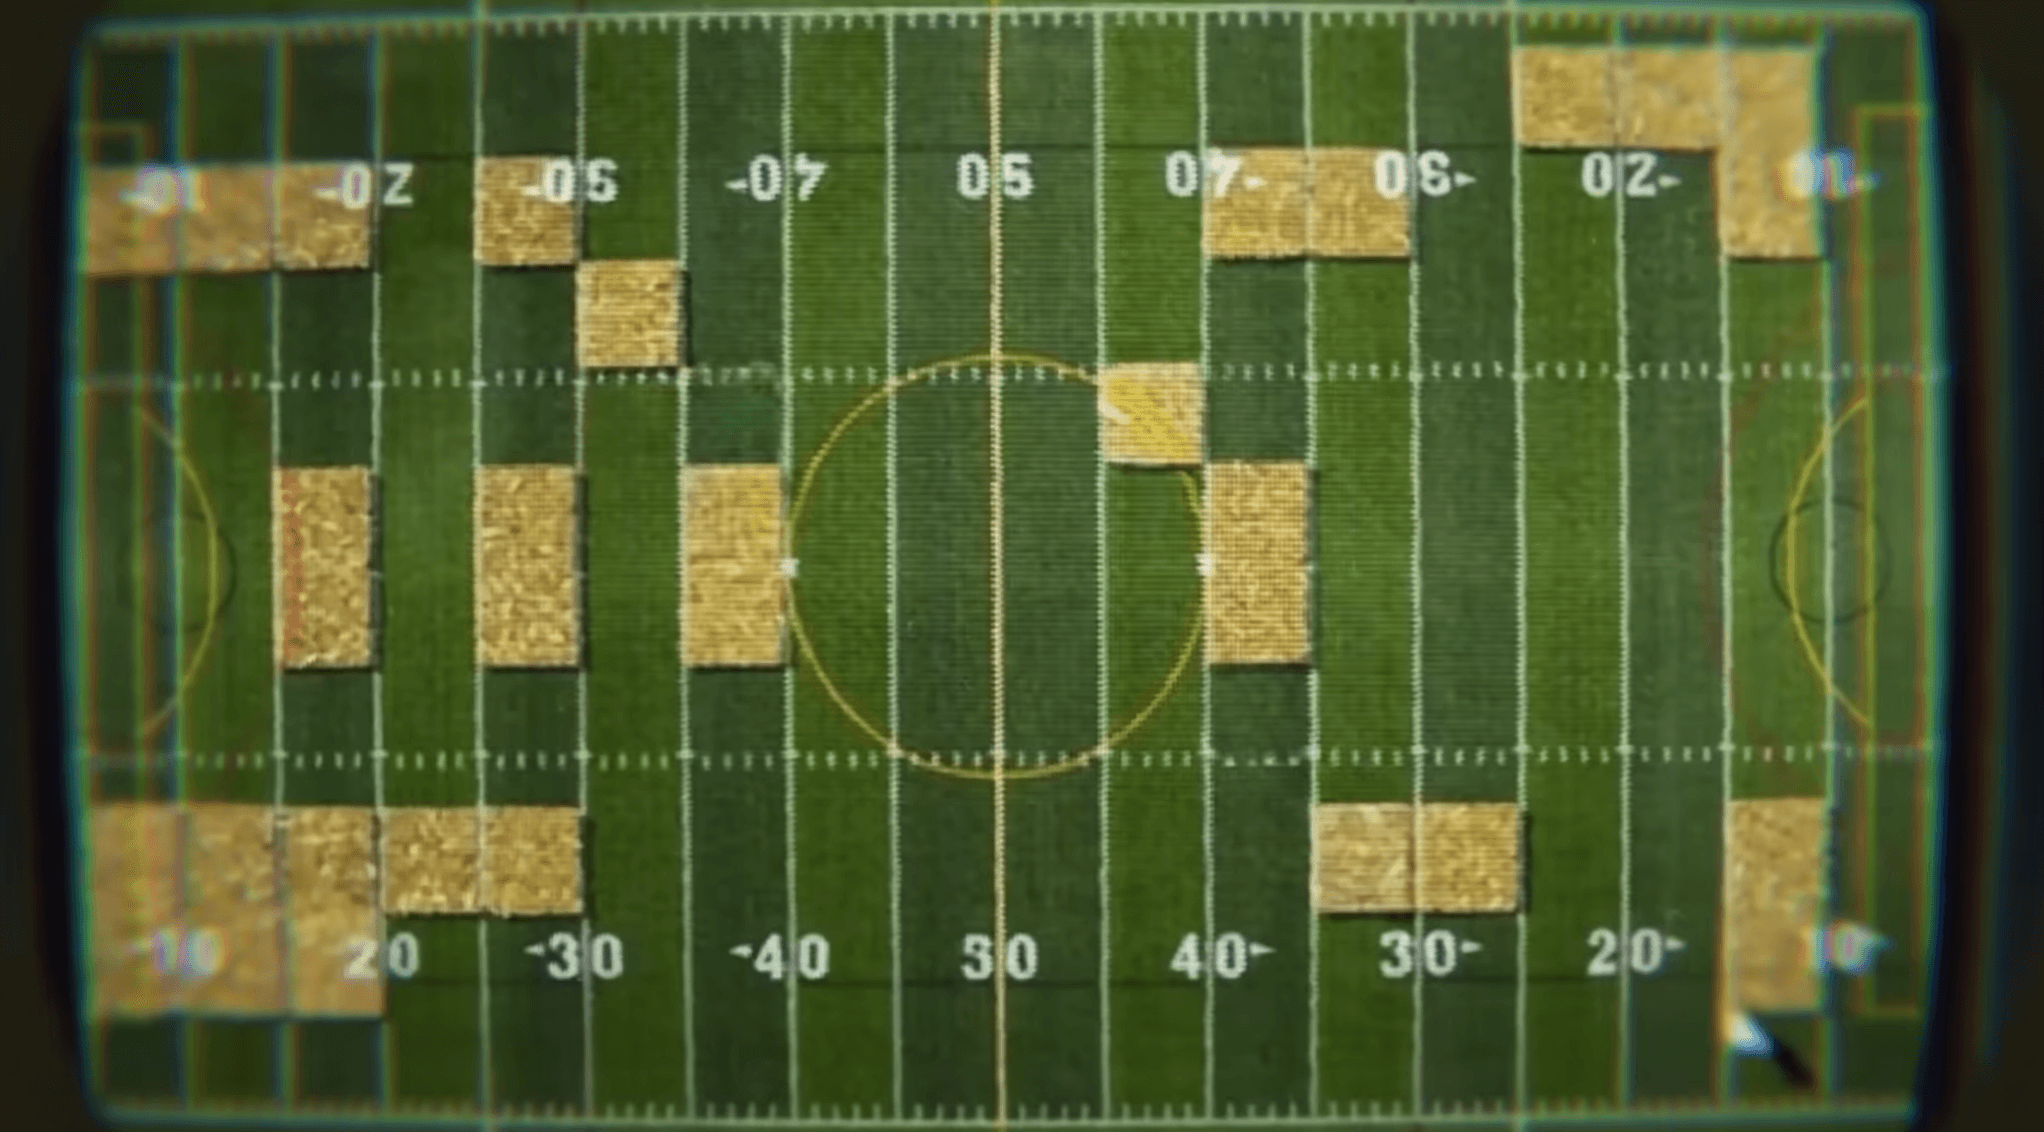
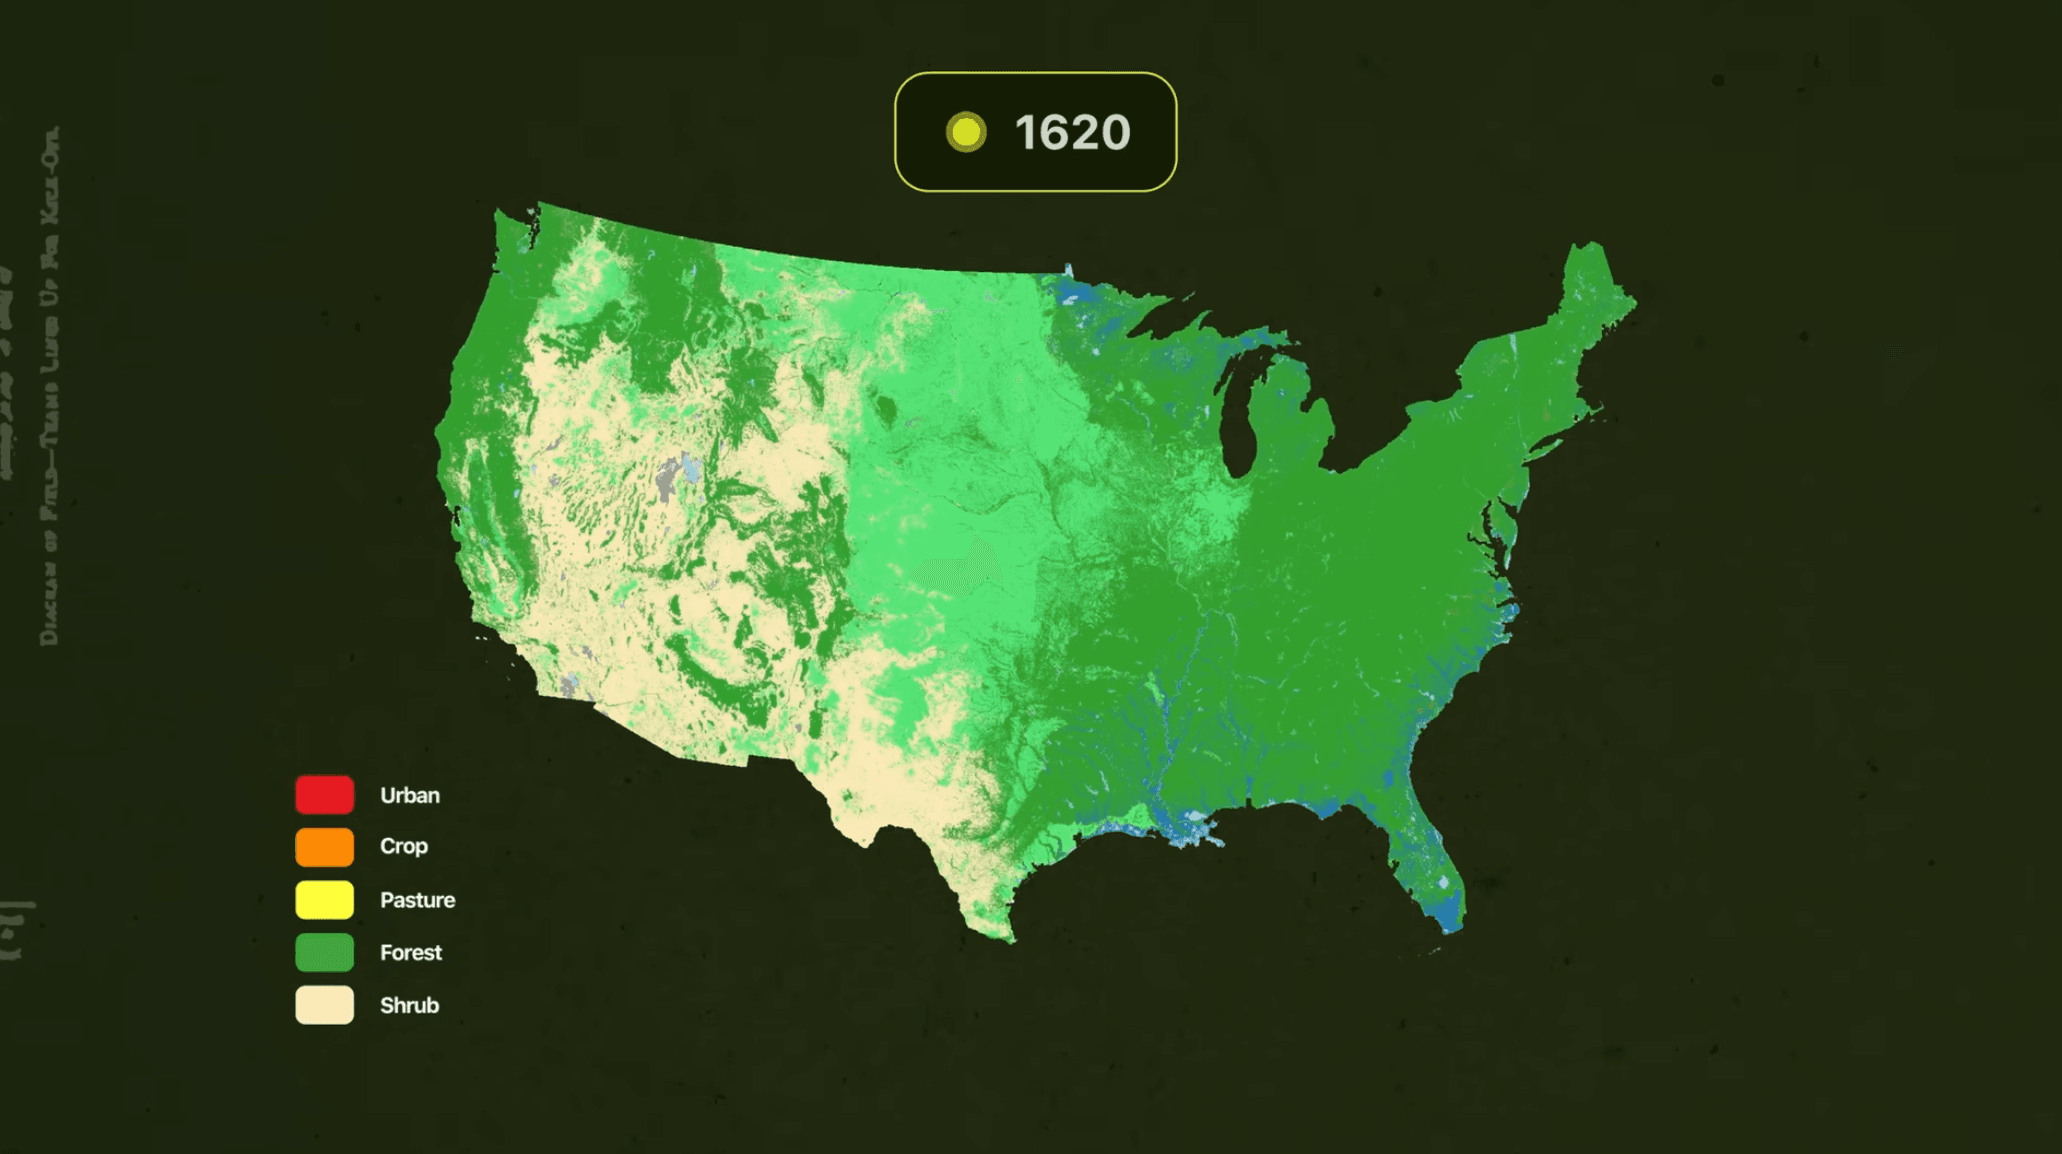
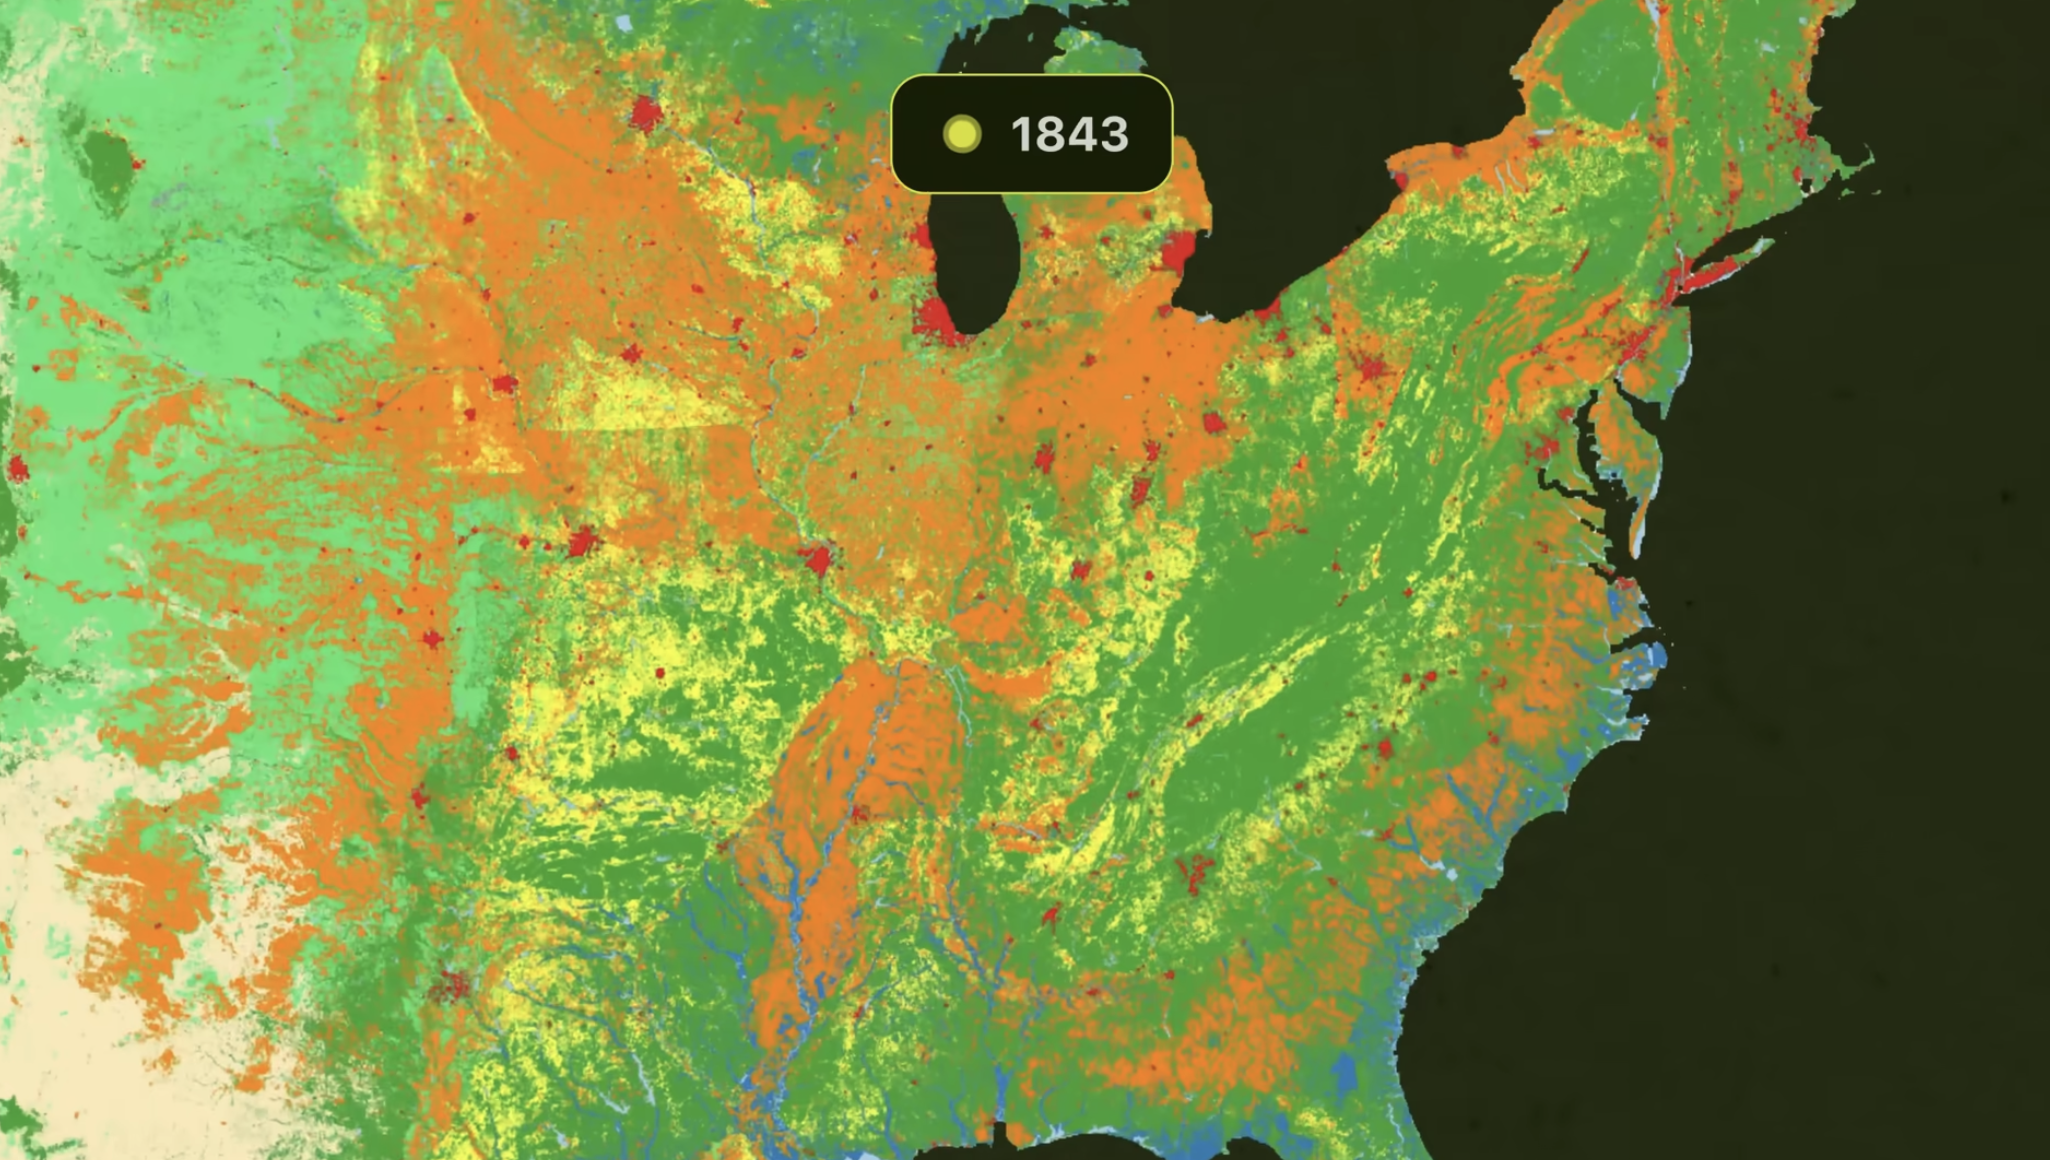
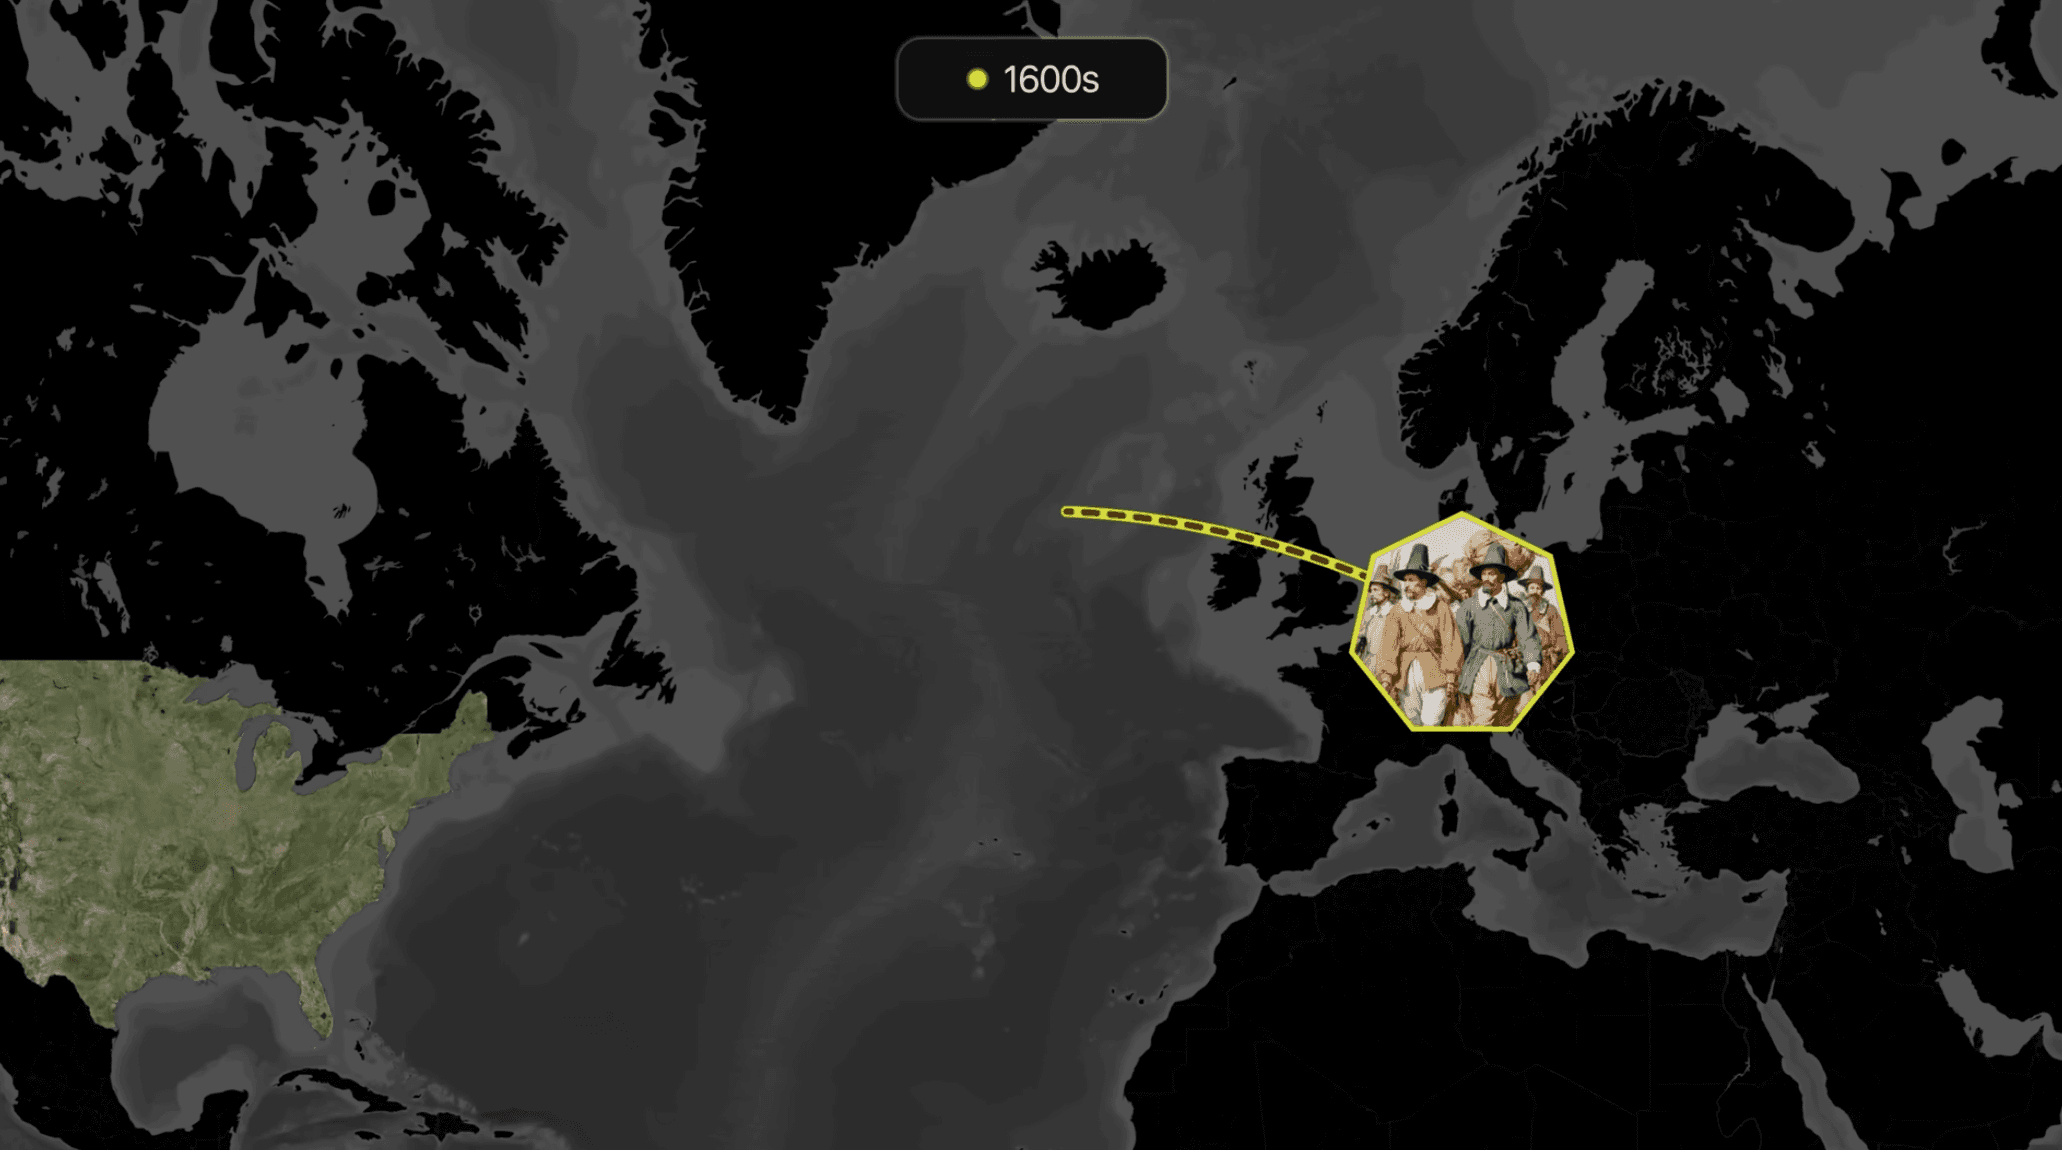
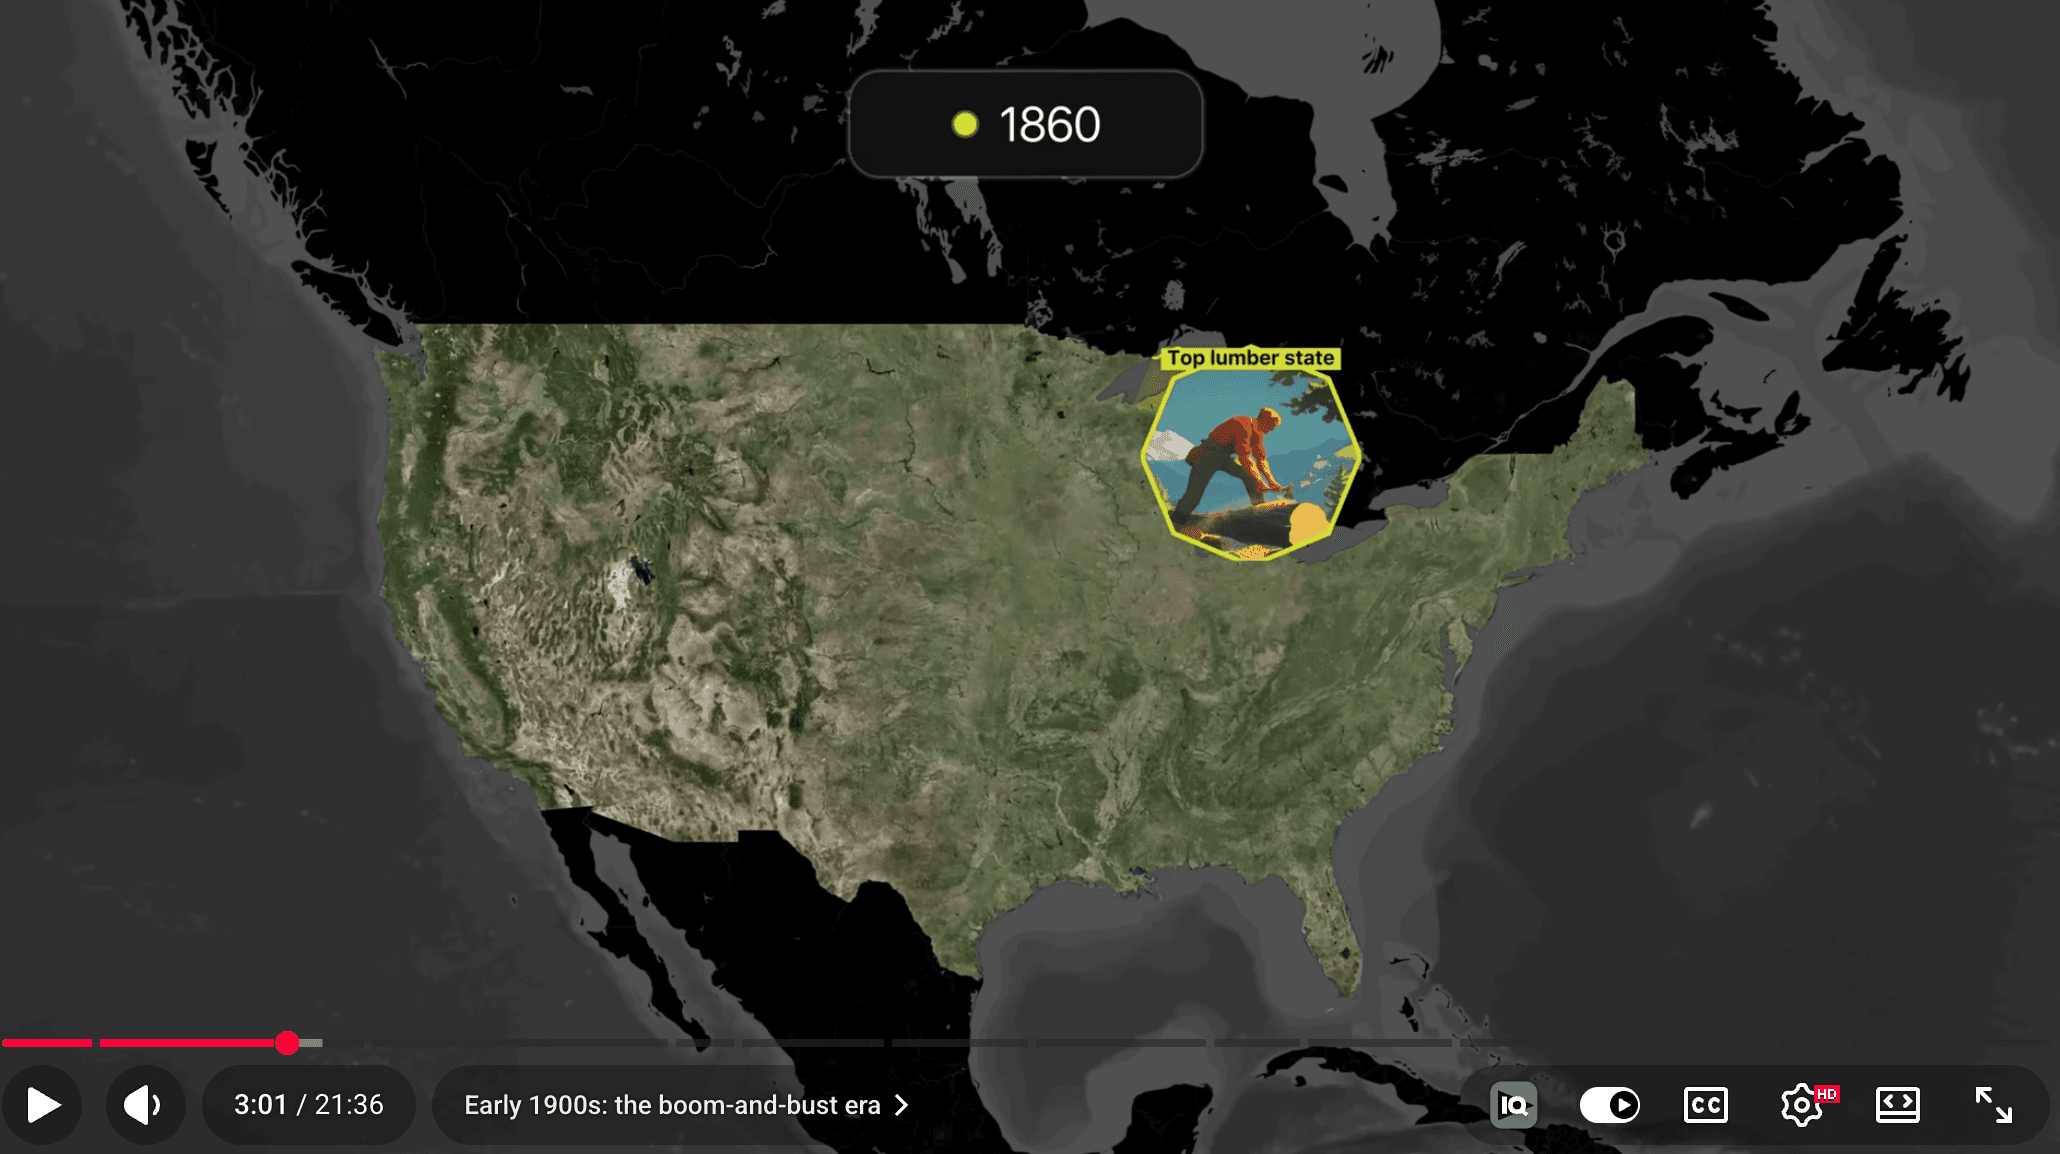
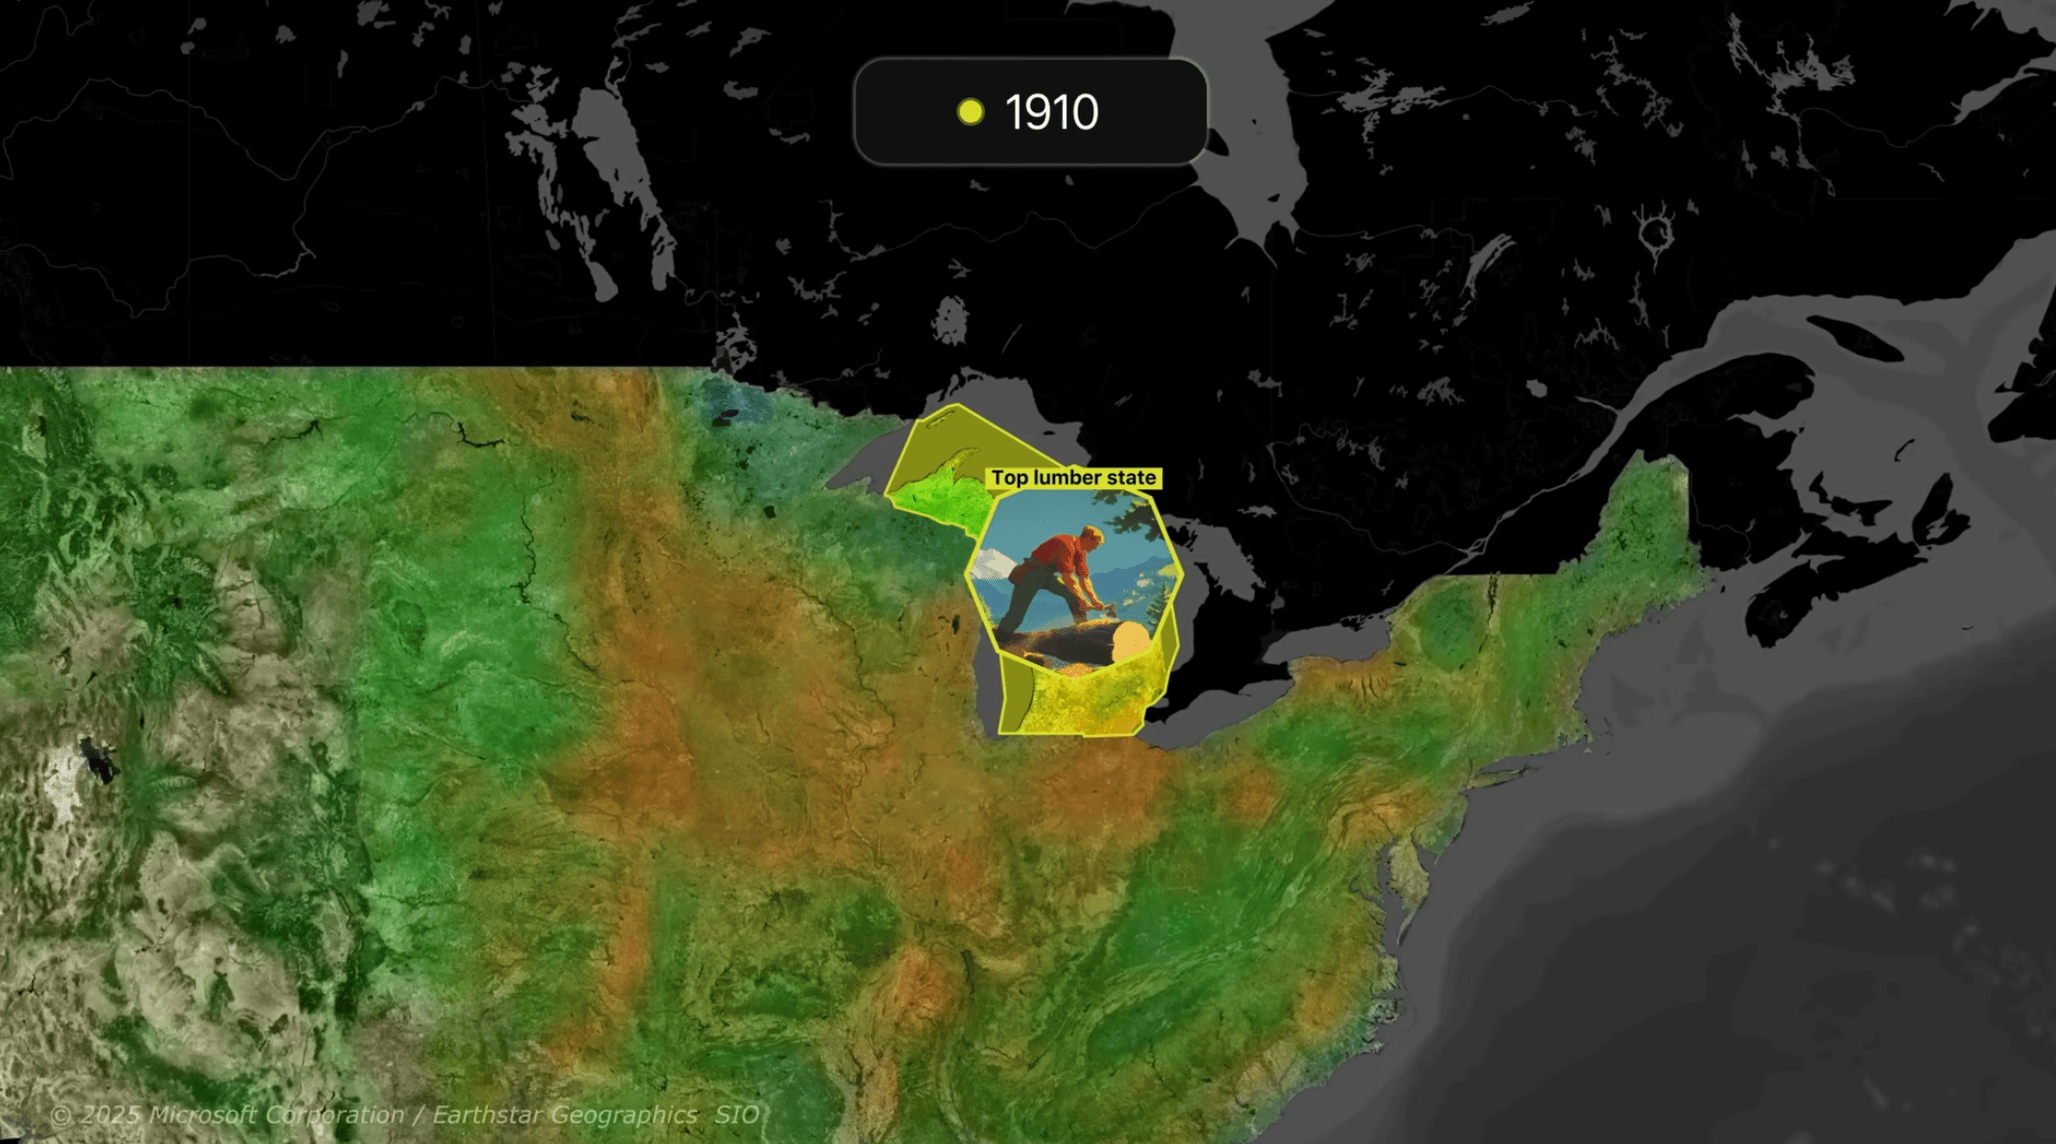
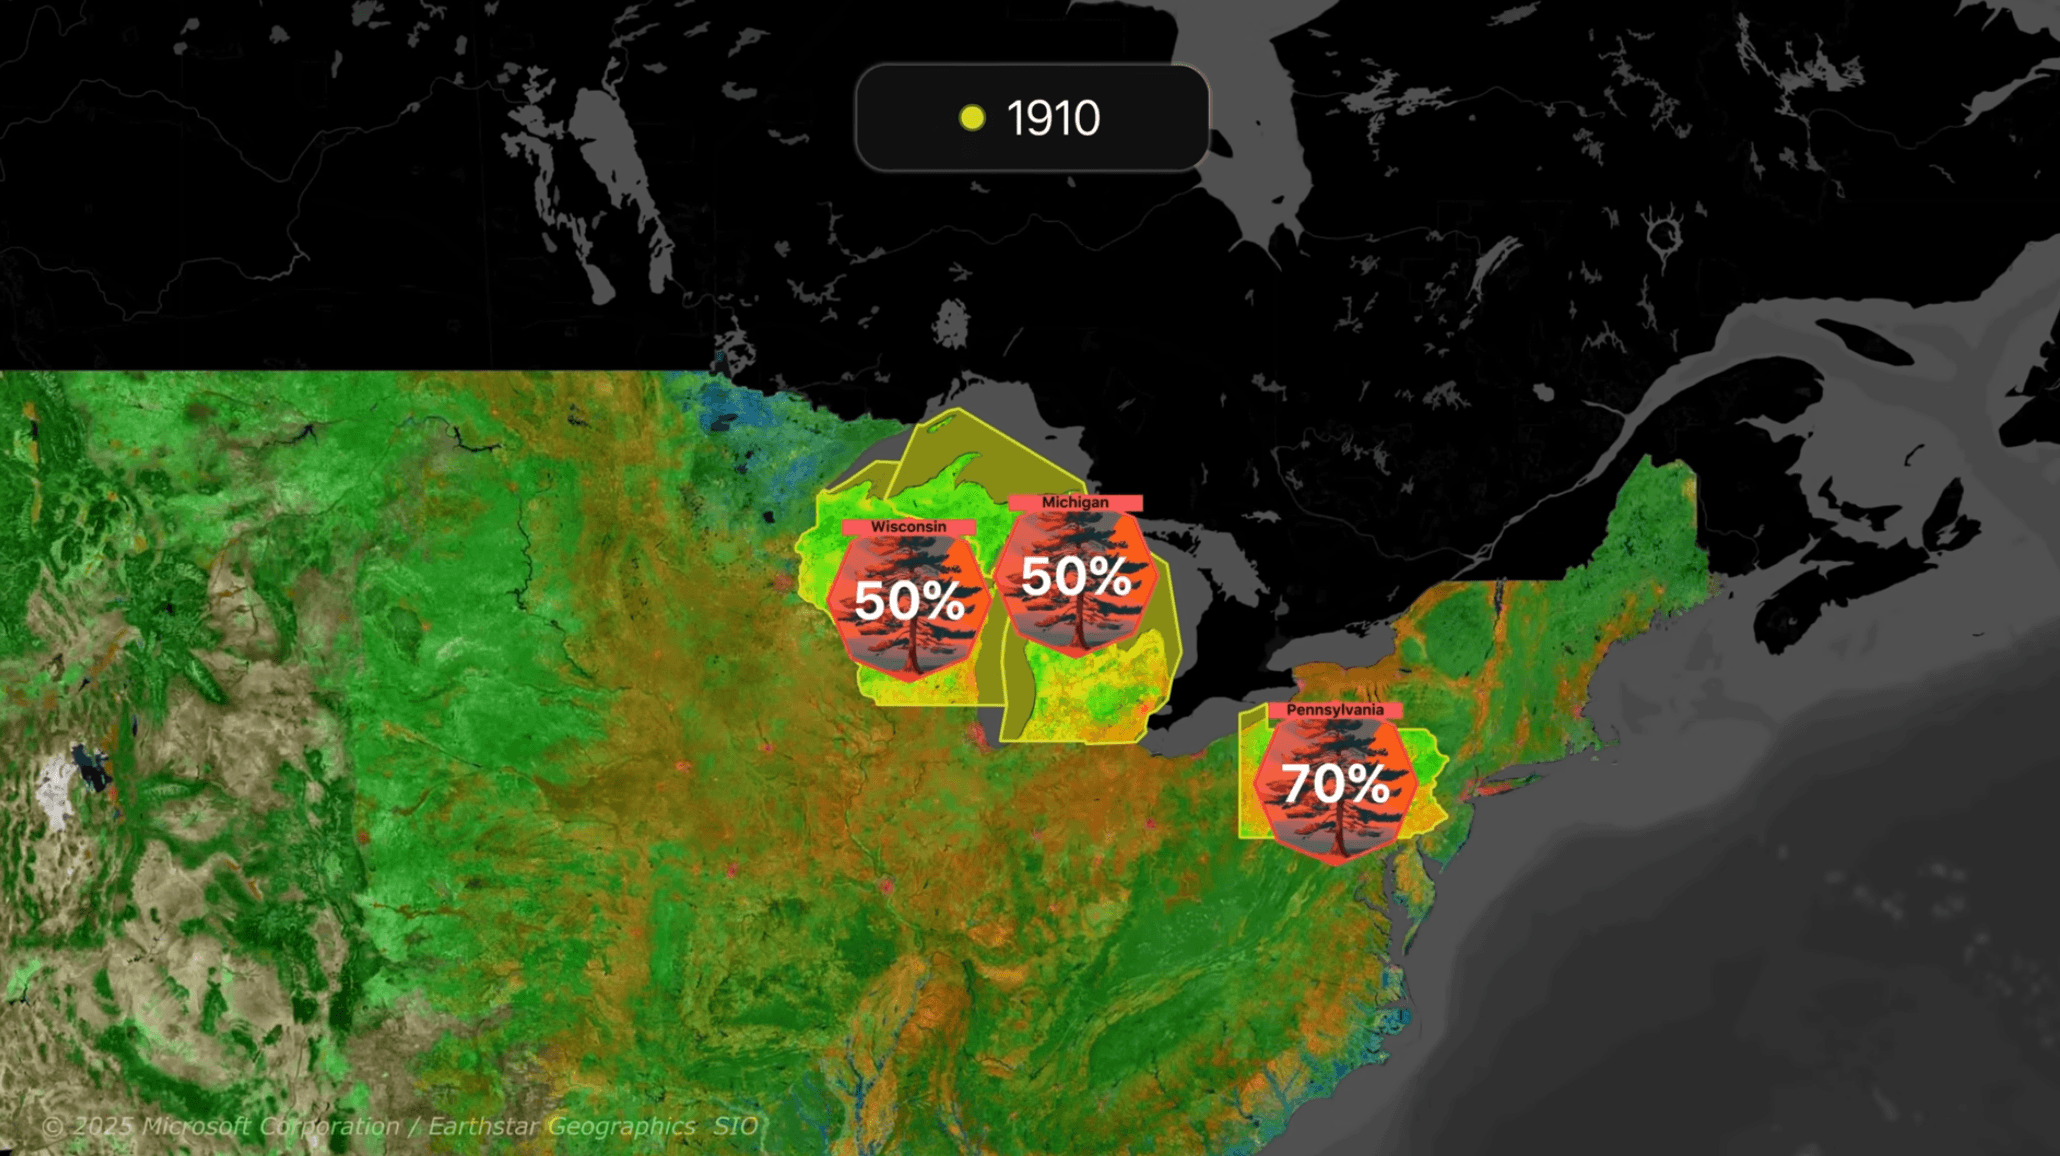
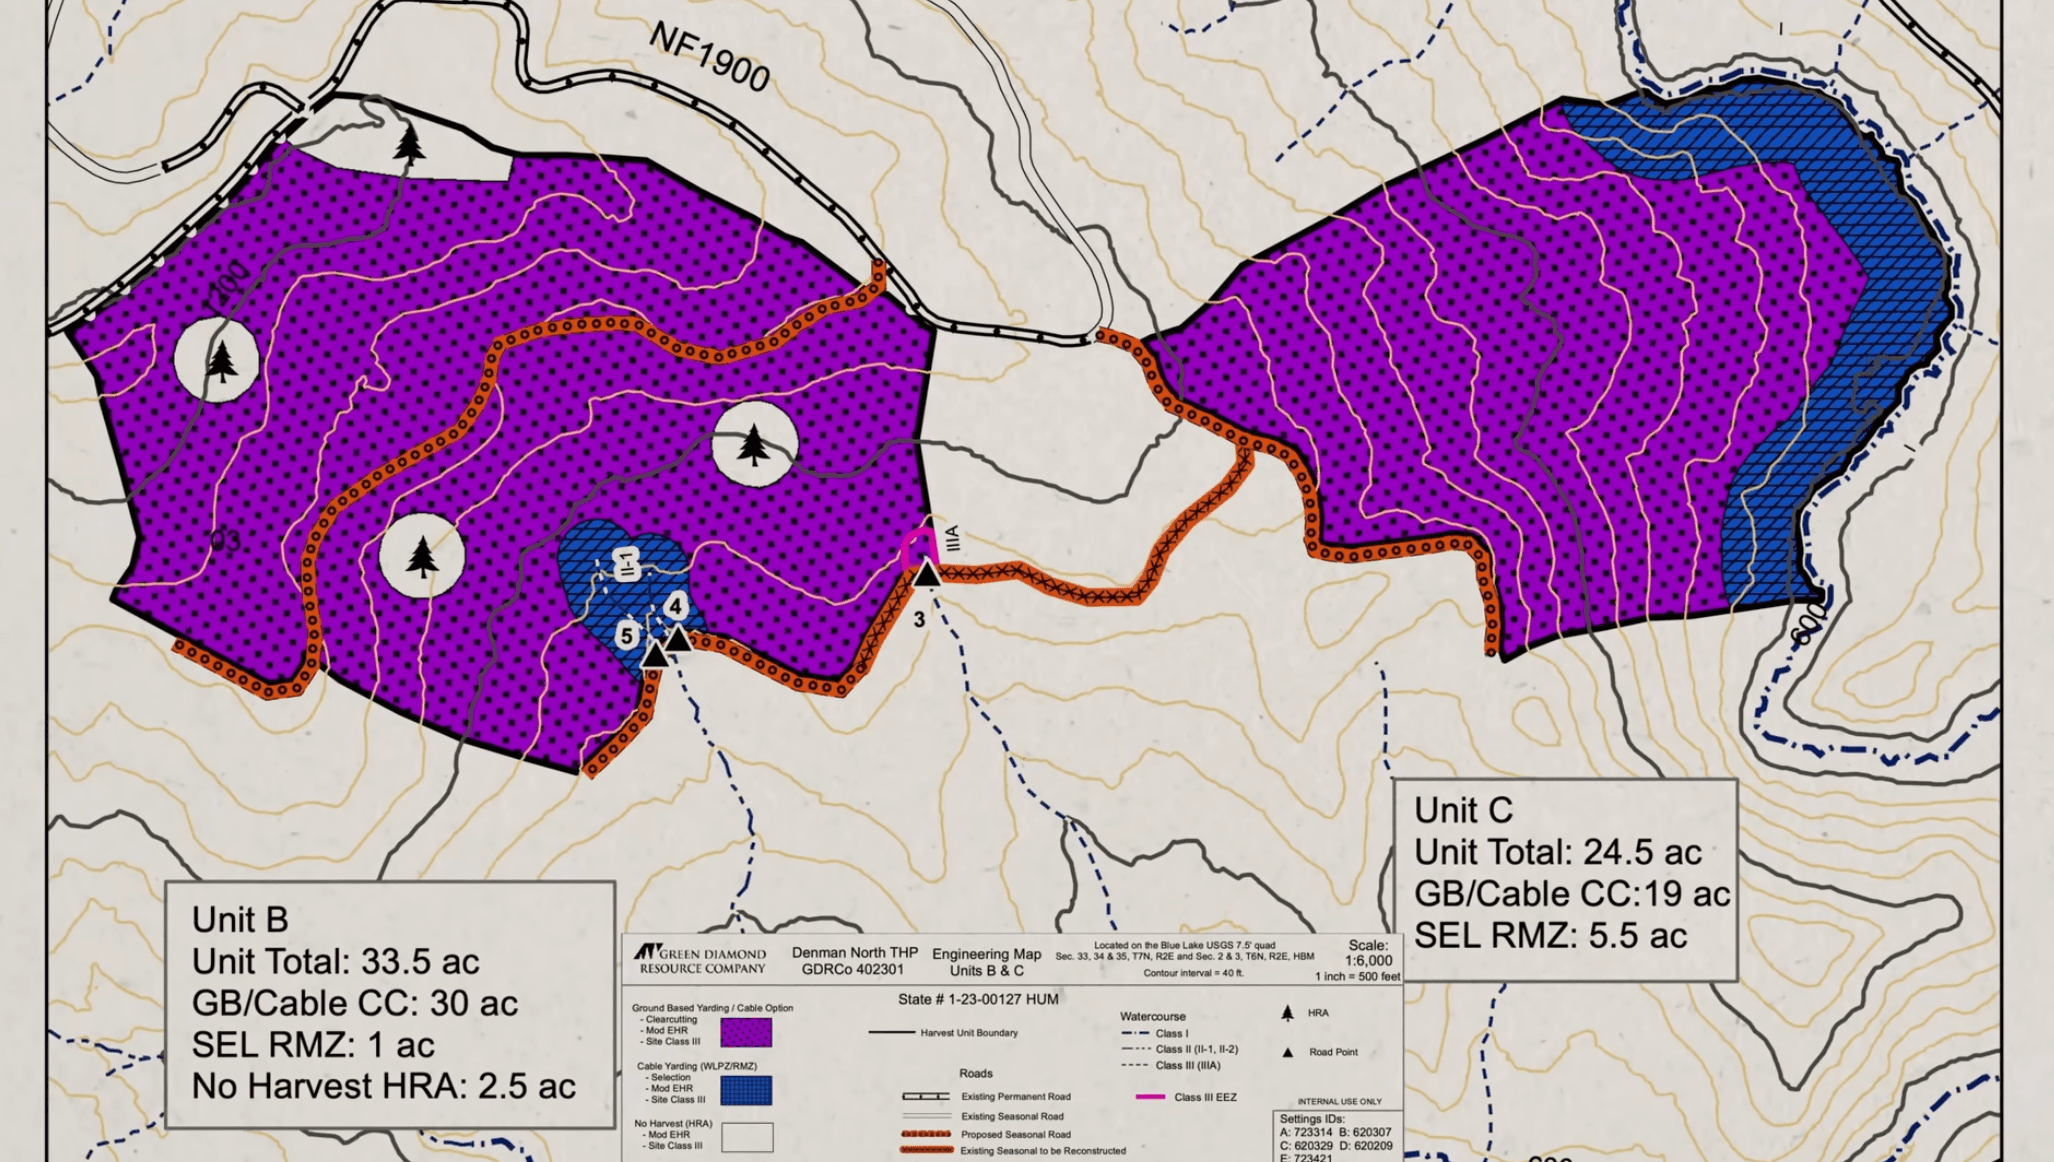
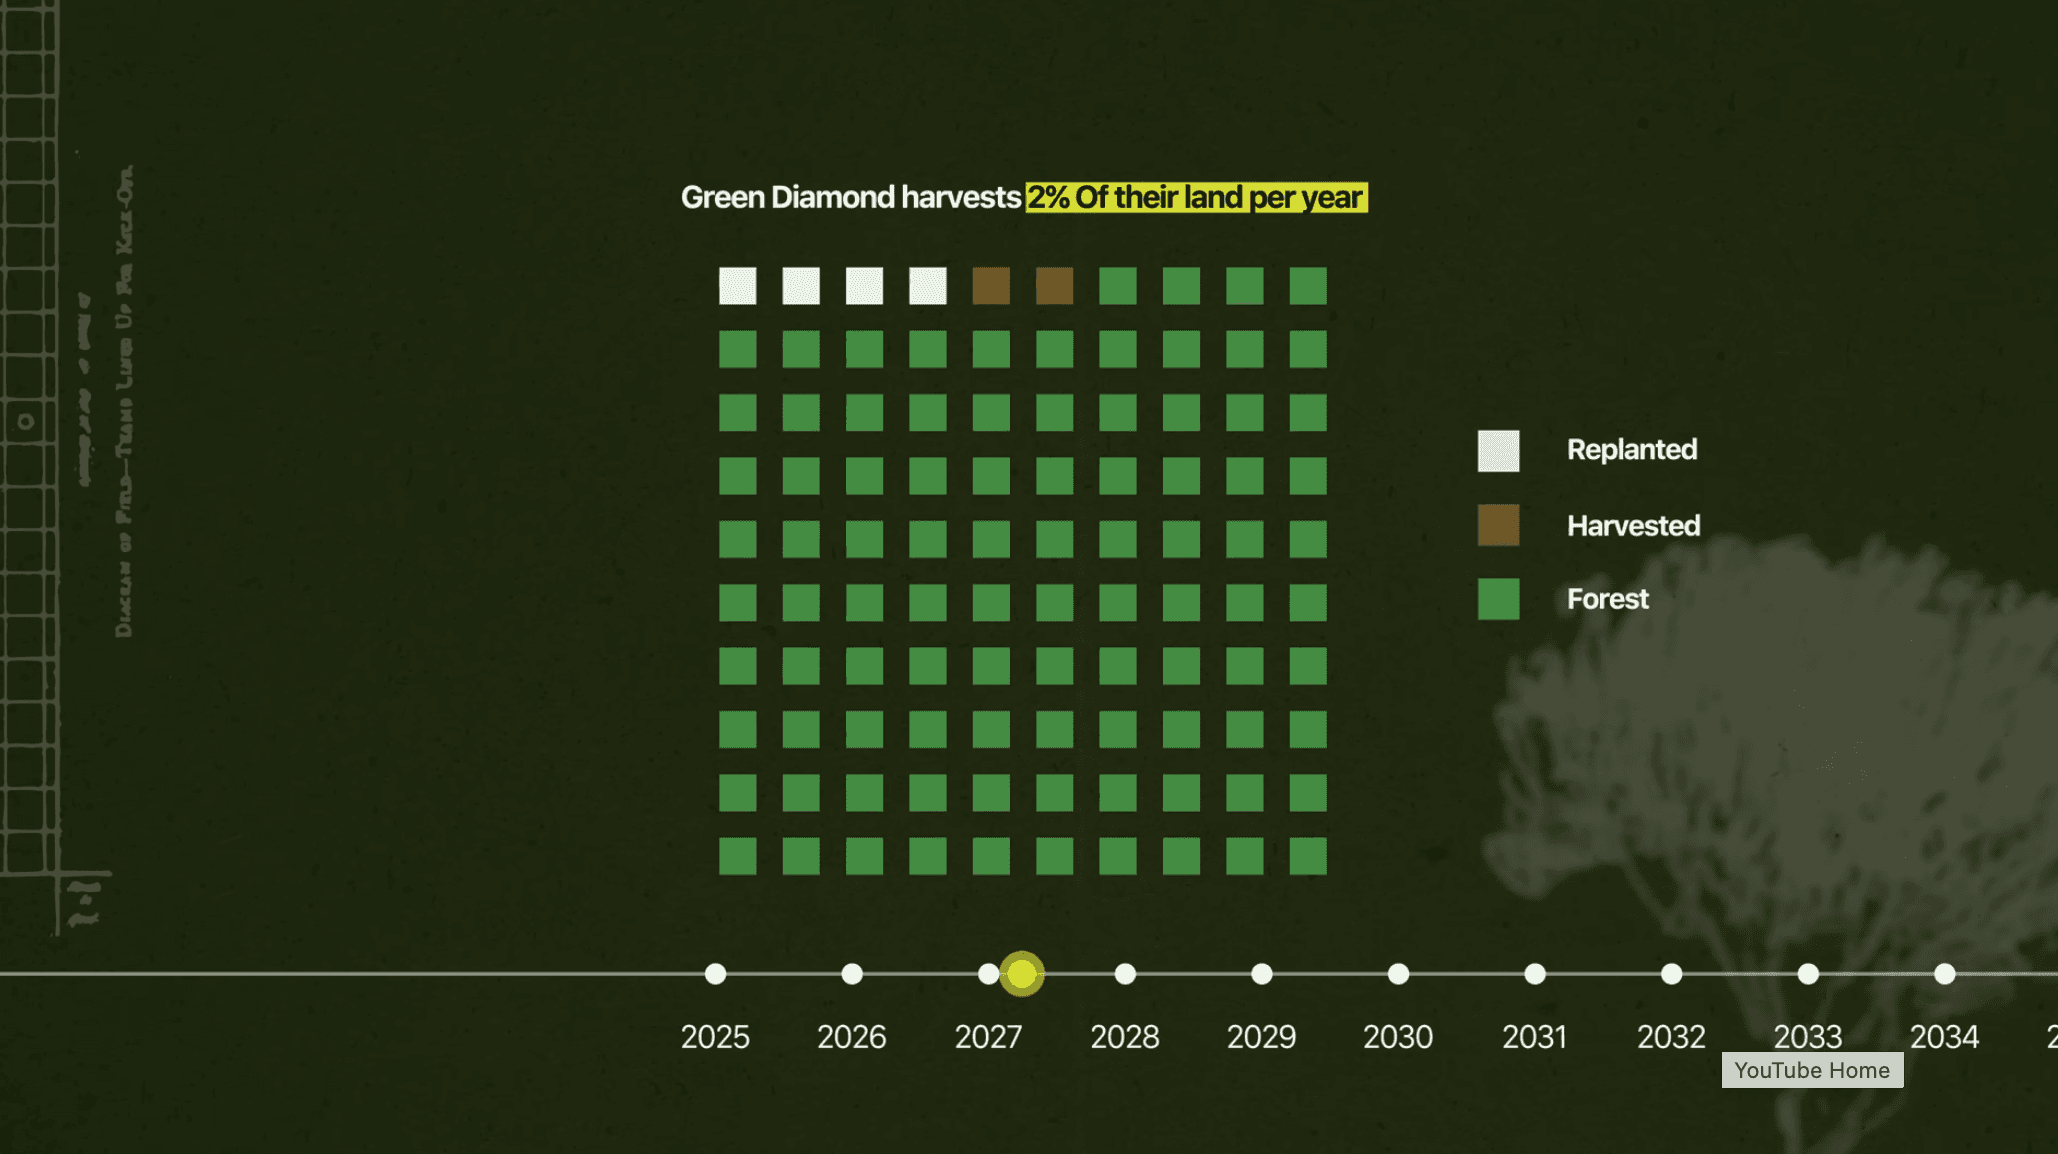
For this video, I worked closely with Christopher Clarke to transform complex rows of raw data and Excel spreadsheets into clear, engaging visualizations. I turned the data into graphics such as charts, bar graphs, maps, and heat maps, making complex information easier for the audience to understand. I collaborated with Christopher to process and structure the raw datasets into actionable information that could be accurately represented in maps and other visualizations. Beyond the data visualization, I also handled **all of the animation and motion design throughout the video**, bringing the graphics to life and integrating them seamlessly into the storytelling while maintaining a clear and consistent visual style.
SELECT KEYFRAMES